The 3 Hidden Costs of Manual SAR Reporting in Drug Discovery
Structure-Activity Relationship (SAR) reporting plays a key role in medicinal chemistry. By showing how structural changes affect biological activity, SAR reporting helps scientists decide which compounds to explore next and which directions may hold the most potential. This requires interpretation and depends on clear, accurate summaries of structural features and biological outcomes.
In many drug discovery teams, preparing SAR reports is still mostly a manual process. Chemists often create tables, charts, and structural comparisons by hand, pulling information together from multiple sources. While this approach has always supported research, it carries several hidden costs that become more pronounced as data volume and project complexity increase.
In this article, we explore the hidden costs of manual SAR reporting, impacting accuracy, collaboration, and scientific decision-making.
Figure 1. Example of multi-vector SAR exploration in a medicinal chemistry program
Drug discovery teams now work with increasingly complex datasets, spanning larger compound collections and multiple assay types. The way SAR insights are compiled and communicated then becomes more important for maintaining efficient design cycles.
Below, we outline limitations that can emerge when SAR reporting depends heavily on manual workflows.
Interpretation risks
Manual SAR preparation requires information to be gathered, copied, filtered, and reformatted across multiple tools. Each step introduces risks for small inconsistencies.
Consider a typical weekly SAR update in a mid-stage program. A chemist may review hundreds of compounds, each associated with sometimes a dozen assay results, with data coming from multiple systems (such as bioassay result repositories, physicochemical property databases, and project-specific prediction databases). This workflow can easily involve thousands of individual data touchpoints in a single reporting cycle.
Even with careful review, small discrepancies can appear. If 1% of entries are misaligned or incorrectly transcribed, these errors may propagate into ranked tables, averaged values, or visual summaries used to guide discussion. Missing a single potent outlier (for example, a compound showing a tenfold improvement in IC50) can meaningfully shift the perceived SAR direction. Similarly, if structures become slightly misordered in a slide deck, the visual narrative of a series can unintentionally suggest a progression that is not fully supported by the data.
Because medicinal chemistry decisions often depend on subtle activity differences between closely related analogs, even minor presentation inconsistencies can influence interpretation without being immediately obvious.
When such discrepancies are detected, the correction process can introduce additional delays. Resolving an inconsistency typically requires tracing the value back to its origin, cross-checking across systems, updating multiple tables or slides, and then revalidating the overall summary. In larger reports, this rework can take substantial time and may push back meeting preparation or decision points.
Slower movement from data to insight
Drug discovery operates in iterative Design–Make–Test–Analyze (DMTA) cycles. The pace at which data is reviewed directly affects how quickly the next set of compounds can be designed.
Medicinal chemists integrate assay results and structural data to produce SAR reports that guide the next round of compound design. They also review patent literature to avoid overlapping with existing claims and to identify underexplored chemical space. Combining these datasets and insights and formatting them into a coherent SAR report can take several hours per week.
With each successive DMTA cycle, new compounds are designed and tested, leading to a growing volume of data to manage. What starts as a compact SAR report covering a focused set of compounds can grow into a large and complex document, making manual maintenance progressively more demanding. Update cycles lengthen, version control becomes fragile, and preserving a clear visual organization requires more effort. Meetings can also lose efficiency, as teams spend more time navigating extensive slide decks rather than focusing on key scientific questions.
Delays per cycle accumulate over time. A one-day lag repeated across 20 cycles in a year can result in roughly 4 weeks of reduced responsiveness. In competitive therapeutic areas, these delays can slow the exploration of promising chemical space and the design and optimization of novel compounds.
Lack of standardization
The way SAR findings are documented is often individualized. When working manually, each chemist has their own approach to documenting compound structures, assay results, and activity data, producing reports that differ in format, terminology, and layout.
Figure 2. Structure–Activity Relationship Matrix (SARM).¹
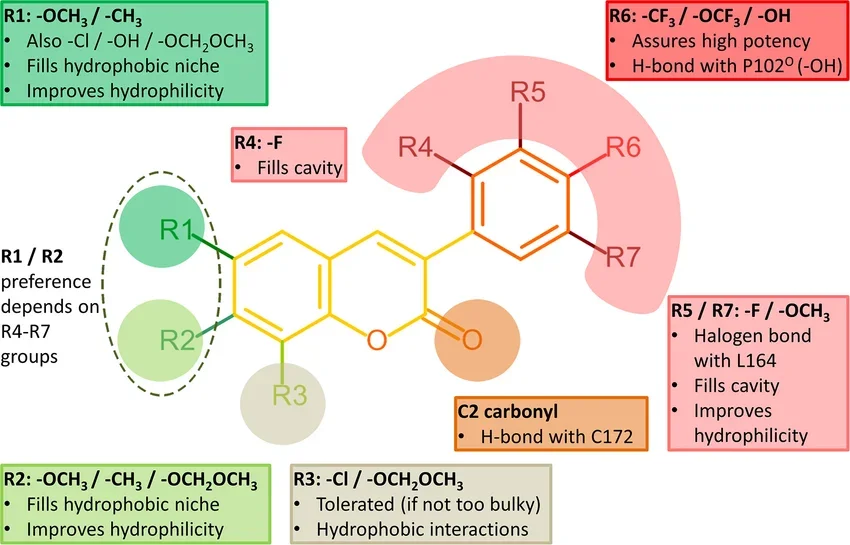
Figure 3. Structure-activity relationship (SAR) analysis of the 3-phenylcoumarin derivatives.²
Although the structure of the report might seem logical and clear to the author, it can introduce variability in how the data are encoded and interpreted, particularly by collaborators from other disciplines, such as data scientists and cheminformaticians or biologists and biochemists. As a result, the same dataset can be read in multiple ways, slowing cross-disciplinary collaboration.
Even within a single chemistry group, the lack of a common reporting standard complicates peer review and slows cycles of compound design and testing.
The consequences can extend beyond individual reports, affecting the efficiency and strategic decision-making in the drug discovery process.
Conclusion
The points discussed above illustrate how manual SAR reporting introduces a number of limitations that tend to emerge as datasets and projects grow. Over time, these constraints can affect how quickly teams review new information and how consistently SAR trends are communicated across a project.
Tools that automate parts of the reporting process can help address these issues by handling tasks that are repetitive or format-dependent, such as organizing structures, keeping results aligned as new data arrives, and optimizing visual presentation. This reduces the amount of time medicinal chemists spend on mechanical steps and ensures that summaries remain clear and consistent as the dataset expands. The broader scientific work remains the focus (interpreting SAR, evaluating hypotheses, and choosing the next compounds to design), as the supporting IT tasks become much easier and time-efficient to manage.
References
1. Yoshimori, Atsushi et al. “Integrating the Structure–Activity Relationship Matrix Method with Molecular Grid Maps and Activity Landscape Models for Medicinal Chemistry Applications.” ACS Omega, vol. 4, no. 4, 18 Apr. 2019, doi:10.1021/acsomega.9b00595
2. Rauhamäki, Sanna et al. “Structure-Activity Relationship Analysis of 3-Phenylcoumarin-Based Monoamine Oxidase B Inhibitors.” Frontiers in chemistry, vol. 6 41. 2 Mar. 2018, doi:10.3389/fchem.2018.00041
Stay updated on our upcoming events, scientific blog articles and other activites by subscribing to our newsletter!